





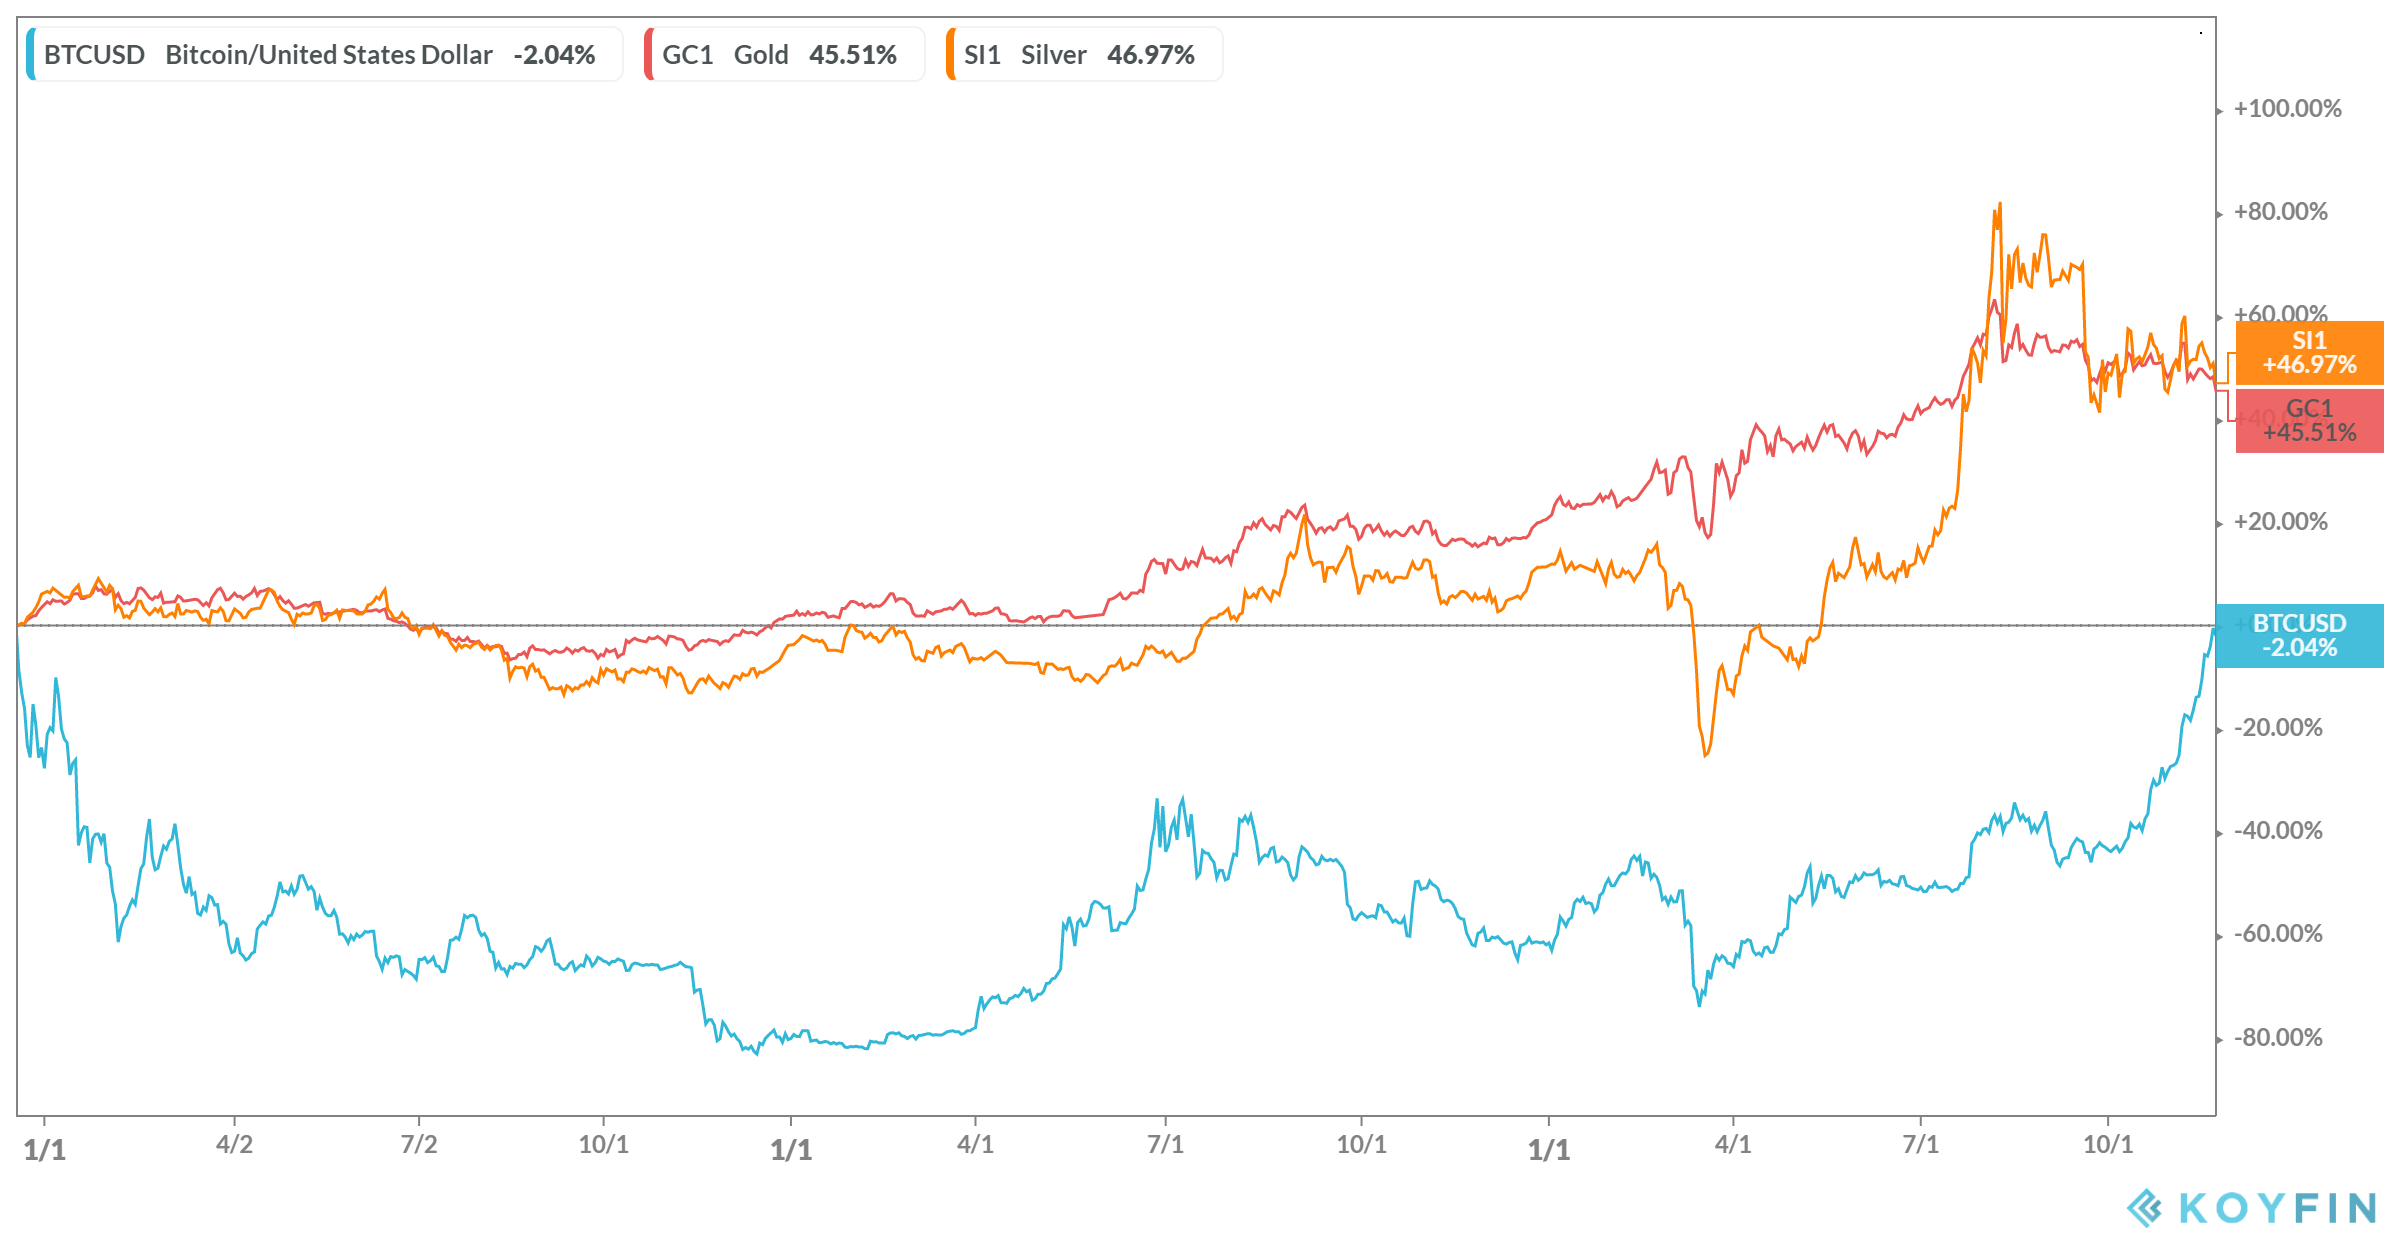
Bitcoin Surges 36% Since August 18 While Gold and Stocks Remain Stagnant: A Shift in Correlation?
Bitcoin (CRYPTO: BTC) has surged by 36% since August 18, 2026, while the two assets it typically moves in sync with have shown little movement. Over the same period, the SPDR S&P 500 ETF Trust (NYSEARCA: SPY) returned only 0.05%, and SPDR Gold Shares (NYSEARCA: GLD) dropped 1.4%. This significant gap has led to renewed discussions about whether the established correlation between Bitcoin, stocks, and gold is coming to an end.
Now priced near $84,000, Bitcoin’s remarkable rise raises the question: Can five weeks of divergence be enough to declare the long-standing relationship with these assets over, or is this a short-term anomaly that might revert to the historical trend?
A Five-Week Window and a 90-Day Window Can Disagree, and They Do

Correlation is a statistic ranging from minus one to plus one, which describes how two assets have moved in relation to each other over a specific period. A score of plus one means they move together perfectly, zero indicates no relationship, and minus one shows they move in opposite directions. Since correlation can vary across time frames, a five-week correlation reading may differ from a 90-day reading, and both can be valid.
Currently, Bitcoin’s performance over the five weeks leading to September 23 shows a rise against a flat stock market and a declining gold price—this occurs in a calm context, with the VIX index, which measures expected stock market volatility, closing at 14.21, below the 15 mark that typically indicates stability.
However, the 90-day correlation shows Bitcoin at a six-year high with gold as of mid-September. Both views have their merits, but the longer 90-day trend presents a stronger case against the shorter five-week divergence.
The Drivers of the 36% Run Are Mechanical, and Mechanical Runs Reverse

Three main factors contributed to Bitcoin’s impressive rally, although each has its limitations. First, the U.S. Treasury doubled its bond buyback program on August 19, injecting cash into the financial system right when the rally began. After that, Bitcoin continued to climb on a series of short squeezes as it broke through resistance levels—this kind of buying pressure tends to ease once short positions are cleared out.
Initially, smaller holders began to sell off their investments at low prices, allowing larger buyers to step in. This inflow was further supported by significant institutional investments. For instance, U.S. spot Bitcoin ETFs attracted $999 million in inflows on September 21—the highest amount since the spike in October 2025. This last factor represents a more sustainable source of demand, as it can continually refresh itself every week.
Nonetheless, correlation metrics highlight price movements without revealing the motivations behind them. They cannot differentiate if a price increase was driven by long-term investors or by leveraged traders reacting to market pressures. Therefore, while the correlation data indicates that Bitcoin has diverged from gold and stocks, it does not predict whether this trend will continue.
Rising Real Yields Are the Live Test, Because Bitcoin Pays No Yield

The five-year real yield—return on a Treasury bond adjusted for expected inflation—grew from 2.18% on September 1 to 2.65% by September 23. Meanwhile, the nominal five-year yield climbed from 4.55% to 4.99%, reaching its highest level since 2007 at 5.03% on September 24. Since Bitcoin provides no yield, rising safe-asset yields can discourage large investors from holding Bitcoin.
Conversely, the overall money supply, measured by M2—a gauge of cash and deposits in the economy—reached $23.3 trillion on August 1, up $120 billion in a month. More cash in the system typically supports both Bitcoin and stocks, raising questions about why Bitcoin has outperformed the S&P 500 by 36 percentage points. If Bitcoin can maintain its gains while yields grow, it suggests a distinct shift from previous correlations.
Is Bitcoin Now Trading on Its Own?
Currently, the answer appears to be no. The divergence has only persisted for five weeks, and the longer-term 90-day correlation with gold suggests otherwise. Additionally, two out of the three key drivers behind Bitcoin’s recent rally—the Treasury buyback and the short squeezes—tend to reverse quickly.
Thus, this divergence is worth noting, but it may not signal a new trading pattern just yet. For Bitcoin to show resilience above $80,875 as yields rise would hint at a weakening of the old correlation.
Investors should watch for net inflows into spot Bitcoin ETFs to remain positive through October 31. A single strong week could be a fluke, but sustained positive inflows over a month would signal serious capital allocation. Similarly, Bitcoin needs to stay above its September 18 close of $80,875, about 4% below its current price, while five-year yields hold steady at or above 5%. If those yields rise and Bitcoin retraces, it would indicate the rally was just another squeeze within the previous correlation framework.
Contact [email protected] for any questions or corrections.
Content Original Link:
" target="_blank">