




Descartes Systems Group has released its August Global Shipping with figures indicting that July 2026 U.S. container import volumes increased 4.5% over June to 2,508,310 TEUs, reflecting typical month-over-month seasonal growth.July U.S.
Descartes Systems Group has released its August Global Shipping with figures indicting that July 2026 U.S. container import volumes increased 4.5% over June to 2,508,310 TEUs, reflecting typical month-over-month seasonal growth.
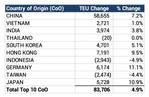
July U.S. containerized imports from the top 10 countries of origin increased 4.9% month-over-month for a combined increase of 83,706 TEUs. China recorded the largest volume gain, increasing 58,655 TEUs (7.2%) to its highest monthly total since July 2025.
Other notable increases came from Hong Kong, up 7,191 TEUs (9.5%), Germany, up 6,174 TEUs (11.1%), Japan, up 5,728 TEUs (10.9%), South Korea, up 4,701 TEUs (5.1%), and India, up 3,974 TEUs (3.8%). Vietnam also posted a modest increase of 2,721 TEUs (1.0%), while Thailand was essentially unchanged.
The only declines among the top 10 sourcing countries were Indonesia, down 2,943 TEUs (4.9%), and Taiwan, down 2,474 TEUs (4.4%).
“July’s import growth shows that demand remains resilient amidst a highly complex and challenging operating environment,” said Jackson Wood, Director of Industry Strategy at Descartes. “As changing tariffs, elevated Middle East maritime risk, tighter Panama Canal draft restrictions and continued Red Sea disruption continue to affect costs, capacity and schedule reliability, having flexible sourcing and routing strategies will help U.S. importers
Content Original Link:
" target="_blank">